Gulf of Aqaba Field Trip
3 - 8 Nov. 2013
OBJECTIVE:
In this work we use geophysical methods to locate and characterize active faults in alluvial sediments.
INTRODUCTION:
Since only subtle material and velocity contrasts are expected across the faults, we used seismic refraction tomography and 2D resistivity imaging to locate the fault. One seismic profile and one 2D resistivity profile are collected at an alluvial fan on the Gulf of Aqaba coast in Saudi Arabia. The collected data are inverted to generate the traveltime tomogram and the electric resistivity tomogram (ERT). A low velocity anomaly is shown on the traveltime tomogram indicates the colluvial wedge associated with the fault. The location of the fault is shown on the ERT as a vertical high resistivity anomaly.
Two data sets were collected at the study site to map the subsurface structure along a profile across the known normal fault described above. The first data set is a seismic refraction data set and the second is a 2D resistivity imaging data set.
A total of 120 common shot gathers were collected (MatLab and DPik format). Each shot gather has 120 traces at equal shot and receiver intervals of 2.5 m. The total length of the profile is 297.5 m . Data were recorded using a 1 ms sampling interval for a total recording time of 0.3 s. A 200 lb weight drop was used as the seismic source, with 10 to 15 stacks at each shot location.
One 2D resistivity profile is acquired at the same location and parallel to the seismic profile. The acquisition parameters of the resistivity profile are:
No. of nodes: 64
Node interval: 5 m
Configuration Array: Schlumberger-Wenner
Total profile length: 315 m
Both seismic and resistivity profiles share the same starting point at the western end of the profile
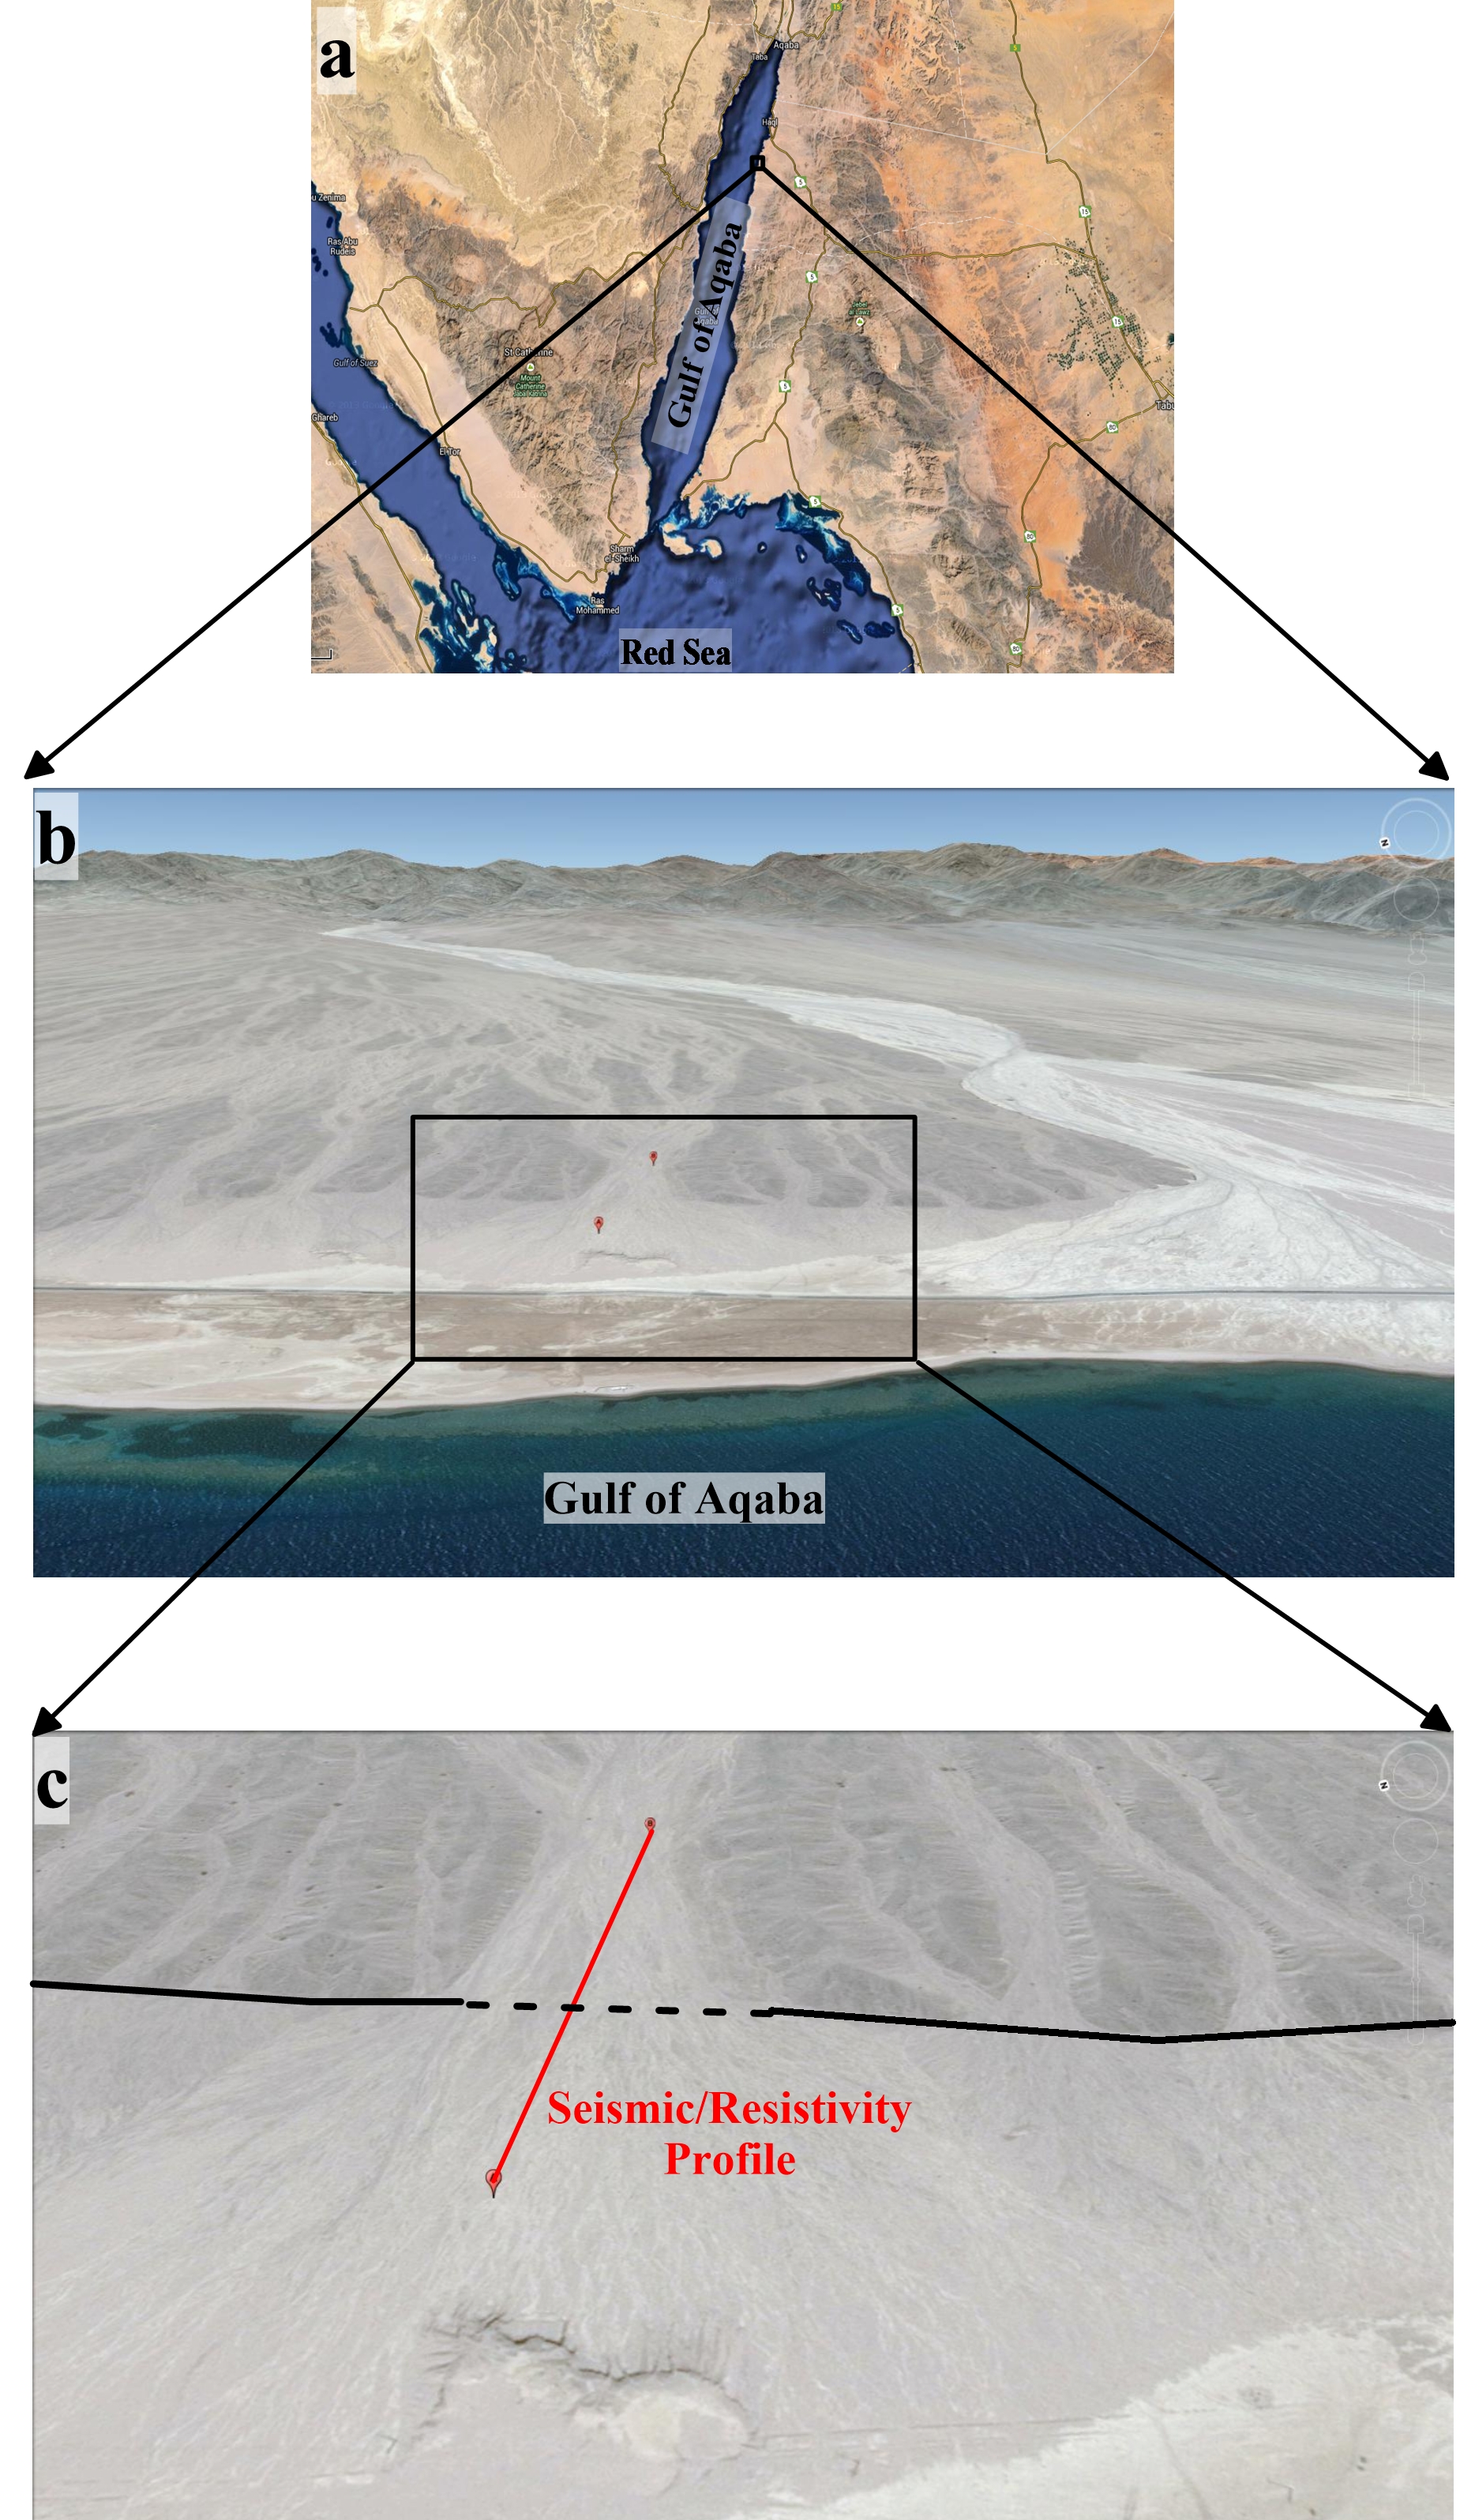
Figure 1. A Google Earth satellite image showing the location of the study area at the eastern side of Gulf of Aqaba.
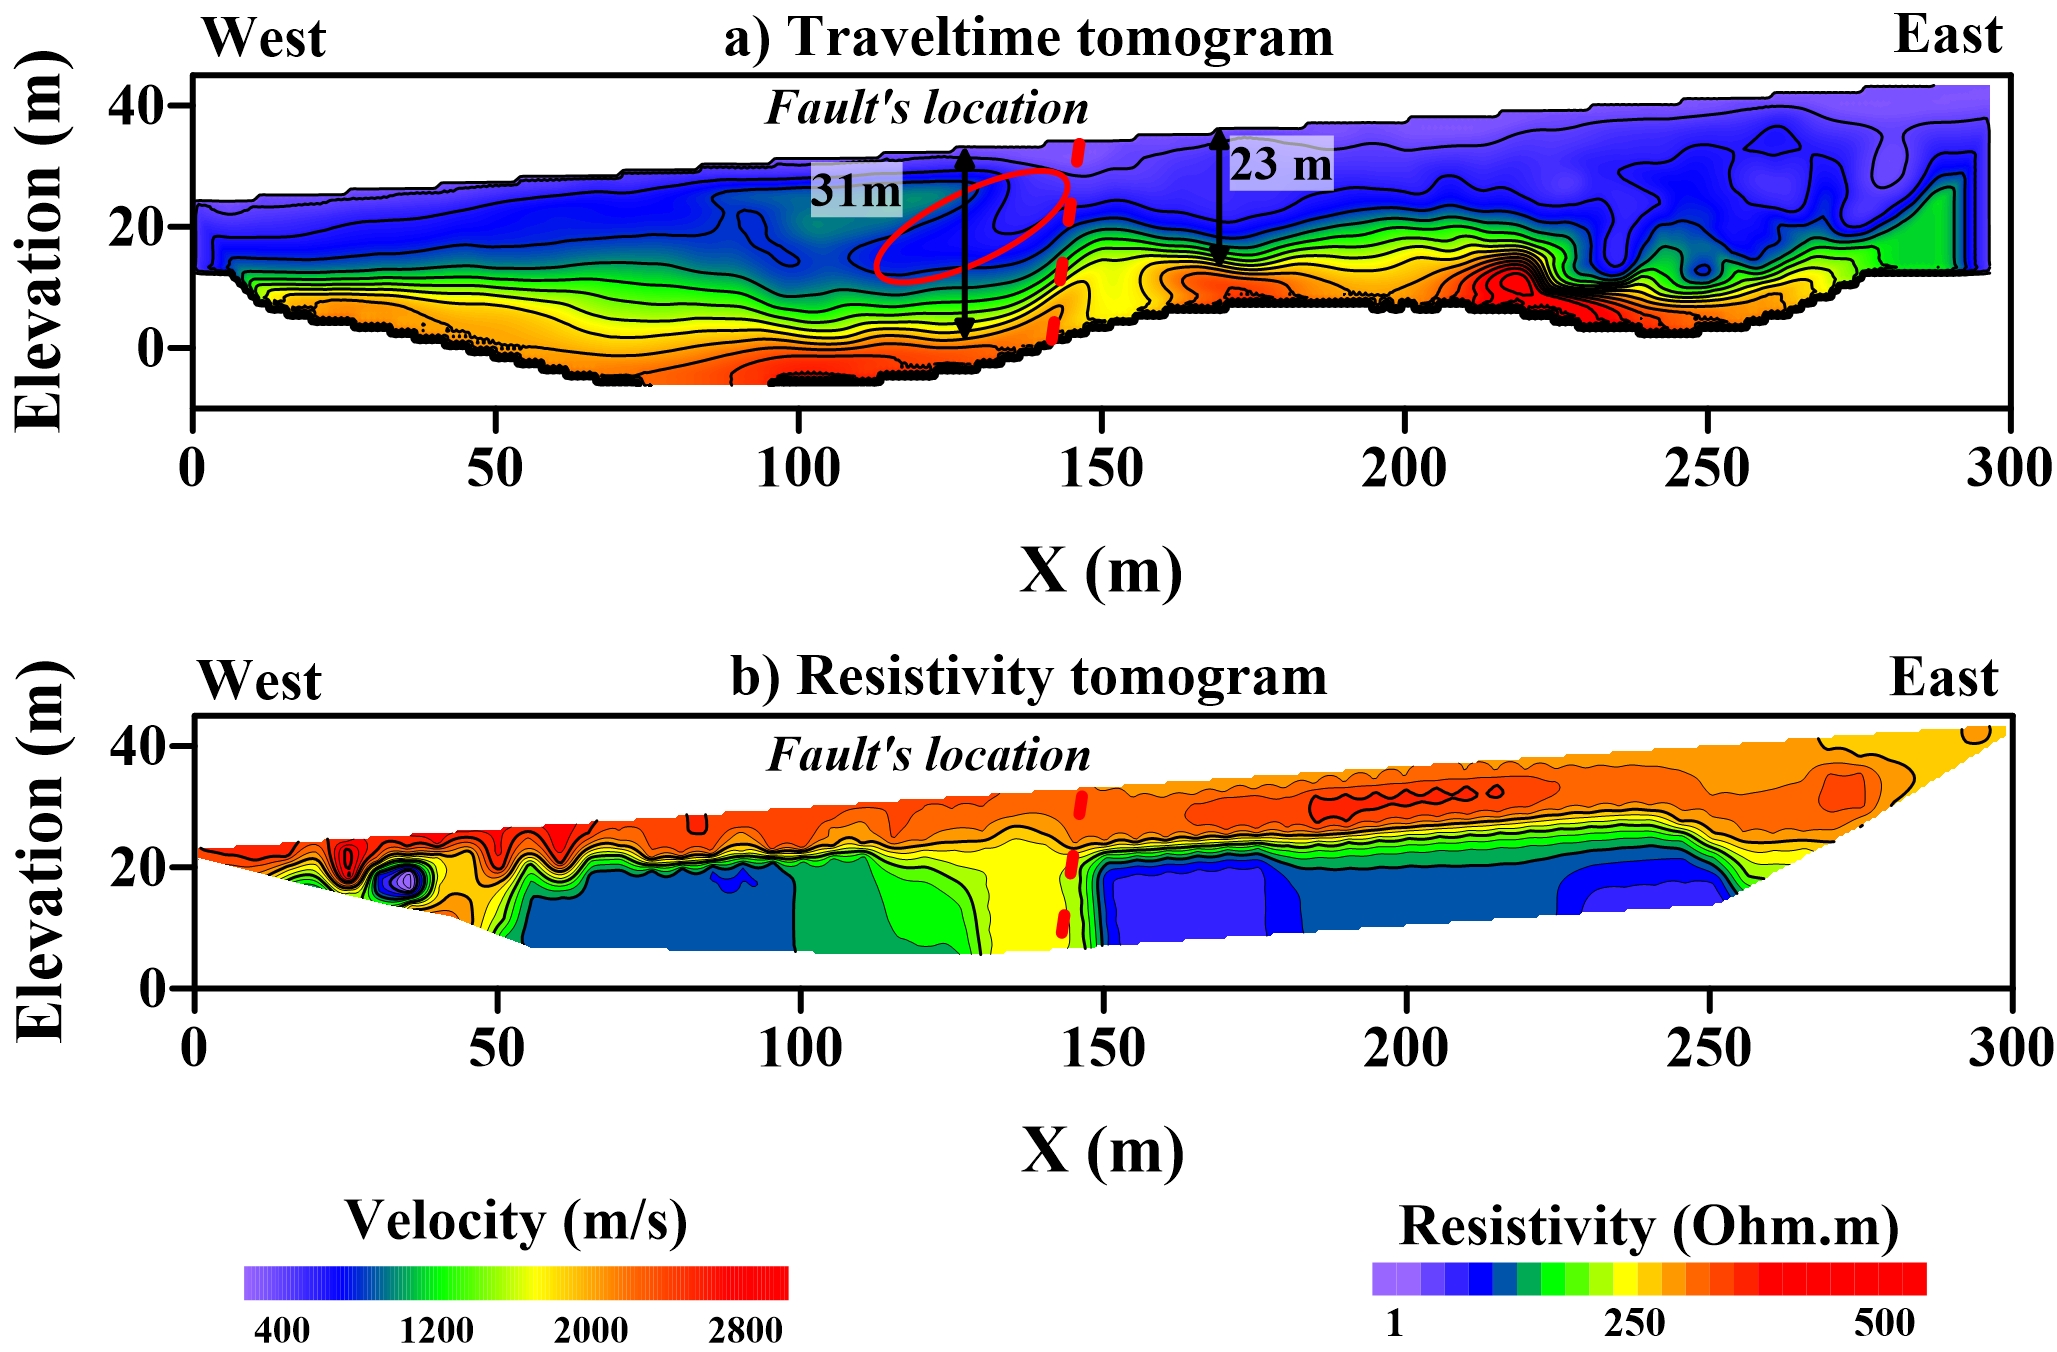
Figure 2. a) The seismic travel-time tomogram and b) the resistivity tomogram. The red-dashed line shows the suggested location of the fault, extrapolated from the fault’s location at the surface. The red-solid ellipse shows a low-velocity region within the tomogram, which might be interpreted as a colluvial wedge associated with the fault.