Qademah Fault
Passive Data
28 Sept. 2014 -
3 Oct. 2014
OBJECTIVE:
In this field
trip we collect passive data to
1.
Convert passive to surface waves
2.
Locate Qademah fault using surface wave
migration
INTRODUCTION:
In this field
trip we collected passive data for several days (see table 1). This data will
be used to find the surface waves using interferometry and then compared to
active-source seismic data collected at the same location (Figure 1).
A total of 288 receivers are used. A 3D layout with 5 m inline intervals and 10
m cross line intervals is used (Figure 2), where we used 12 lines with 24
receivers at each line. Receiver order is shown in Figure 2.
You will need
to download the file (rec_times.mat), it contains important information about
1.
Field record no
2.
Record day
3.
Record month
4.
Record hour
5.
Record minute
6.
Record second
7.
Record length
P.S. 1. All
files are converted from original format (SEG-2) to matlab format
P.S. 2.
Overlaps between records (10 to 1.5 sec.) are already removed from these files
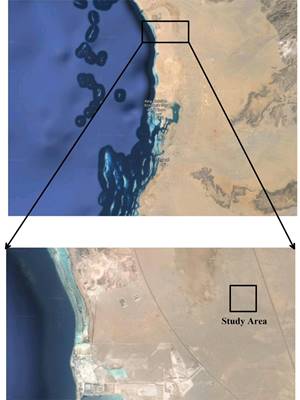
Figure 1: A
google map shows the location of the study area, around 40 km north of KAUST.
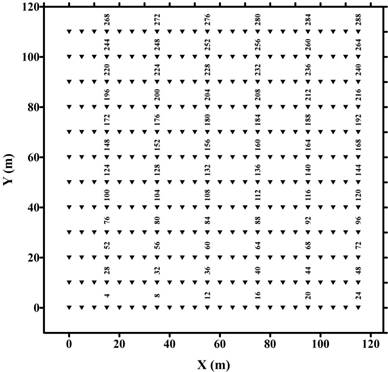
Figure 2: The
receiver layout.
|
Date |
Start
Recording Time |
End Recording
Time |
Actual
Recording Time |
Download Data
(MatLab) |
|
28 Sept |
15:37:27 |
15:51:42 |
352 sec |
|
|
29 Sept |
TBA |
TBA |
N/A yet |
Get File |
|
30 Sept |
TBA |
TBA |
N/A yet |
Get File |
|
1 Oct |
10:41:00 |
23:59:59 |
10.9 Hours |
Get File |
|
2 Oct |
00:00:07 |
23:59:42 |
19.6 Hours |
Get File |
|
3 Oct. |
00:00:22 |
15:43:18 |
7.96 Hours |
Get File |