Exercise in Prestack Born Modeling
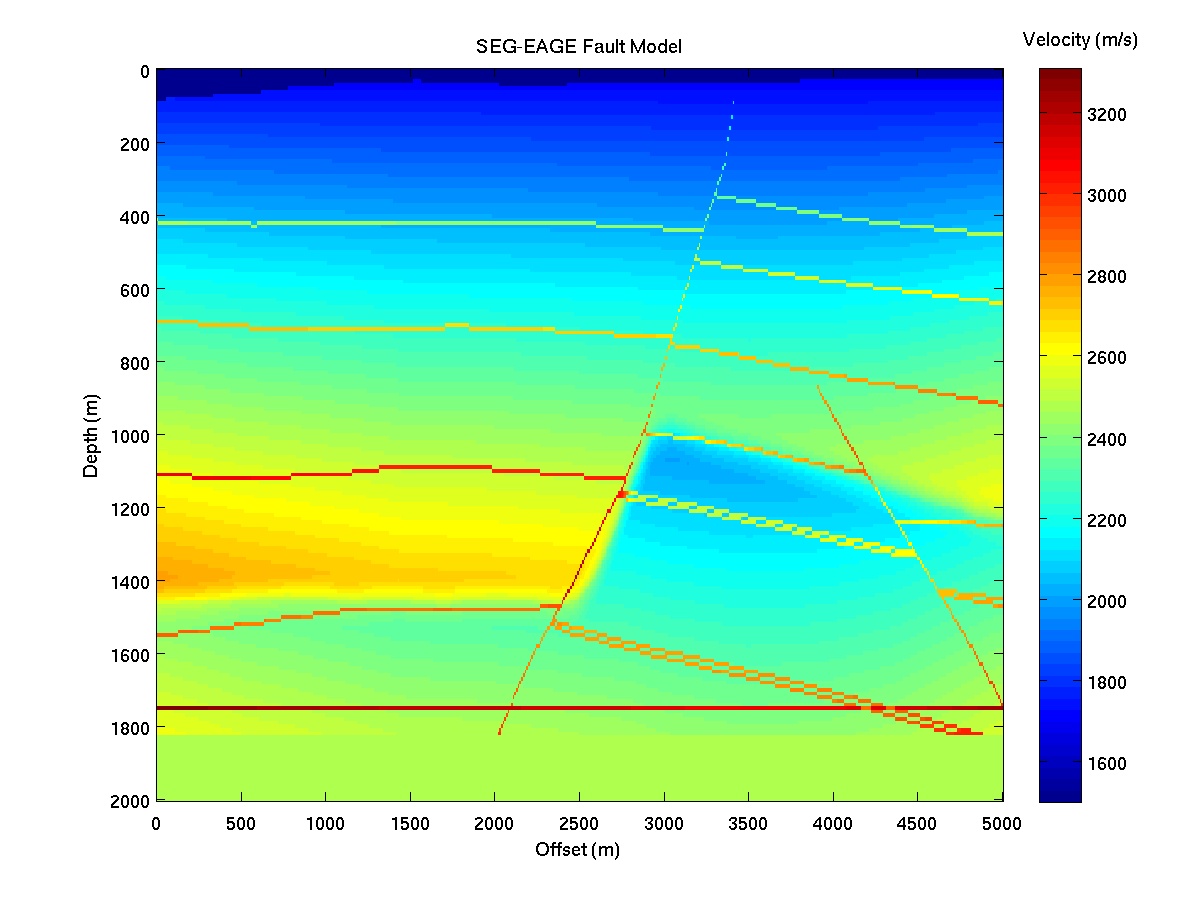
Figure 1. Velocity model obtained from SEG/EAGE salt model.
Goal: The goal is to learn how to compute
prestack shot gathers under the Born approximation
(i.e., no multiples included). An eikonal solver is used
that computes traveltimes for heterogeneous velocity models.
Expected Outcome: Valuable prestack modeling tool for generating
synthetic shot gathers.
Skills Learned: Connecting theory and mathematics of
Lippmmann-Schwinger Born approximation to generating
shot gathers by MATLAB code.
Procedure:
- Download the prestack modeling program
model1.m and Ricker wavelet generator
ricker.m.
Also download the traveltime modeling program
Mray.m and an example traveltime modeling program
raymodel3.m, and
plotting routine plot1.m.
Also download the model
velvector vector in ascii format
or in velvector.mat .
The velocity model "velvector" is a vector of the velocity model
in units of m/s. To display it type
load velvector; %or load velvector.mat
vel=reshape(velvector,501,201);imagesc(vel');
- Examine the modeling code model1.m
and convince yourself it performs prestack modeling for a shot at (sx,sz)=(1,1) grid position, or at the
cooridinates of (sx,sz)=(10 m,10 m).
- Type model1 in MATLAB and generate final shot gather. The code model1 computes the
the traveltime matrices traveltimesrc([1:nx],[1:nz],ixsrc) for a shot indexed by ixsrc,
where the shots are assumed to be at the surface.
- What are the shortest and longest wavelengths in the associated wave propagation?
Explain how you arrived at your answer.
- Compute the shortest and longest apparent wavelengths from your shot gather.
Explain how you arrived at your answer.
- Compute the highest frequency in your data.
Explain how you arrived at your answer.
- Examine the sensitivity of the shot gather accuracy to grid size spacing by
tripling the size of the gridpoint spacing dx and rerunning the code.
Repeat test for a finer grid sampling. Do artifacts increase with a coarser sampling? Why?
What is your empirical guess as to how dx should be related to shortest wavelength?
- Examine the sensitivity of the shot gather accuracy to time sampling interval dt by
tripling the size of the time sample interval dt.
Repeat test for finer sampling. Do artifacts increase with a coarser sampling? Why?
What is your empirical guess as to how dt should be related to highest frequency in the data?
- Notice that the Ricker wavelet does not begin at time zero but there is a lag
in its initial non-zero amplitude. How does this affect the seismograms in terms of
the initial onset of direct arrivals and reflections?
- Change the code so that you produce 5 shot gathers where the shots
are evenly spread out along the top surface.
Identify the reflectors int he model associated with some of the events seen in one
of the shot gathers.
See if you can change the code so that you don't need to recompute the traveltime
tables for different shot locations.
- Optional Fun Exercise: Find the synthetic seismograms for the above model by
a FD solution to the wave equation for the same model. Compare the results to the Diffrcation stack shot gather.
What is the difference in run times?
- Lab reports should be written in a style similar to a scientific paper so that the reader can clearly understand what you did and be convinced that your procedure is correct. All answers to questions should be written in complete sentences. The reader should be given enough detail so that they can reproduce your results if they had your code. Each question or sub-exercise should be stated, the answers should be written in complete sentences, figures should have labels on all axis with correct units, a title label should accompany each graph, and each figure should be labeled with a number and a caption. Show any work that you might use if a mathematical derivation is called for.