Velocity Color Photo Reverse Engineering

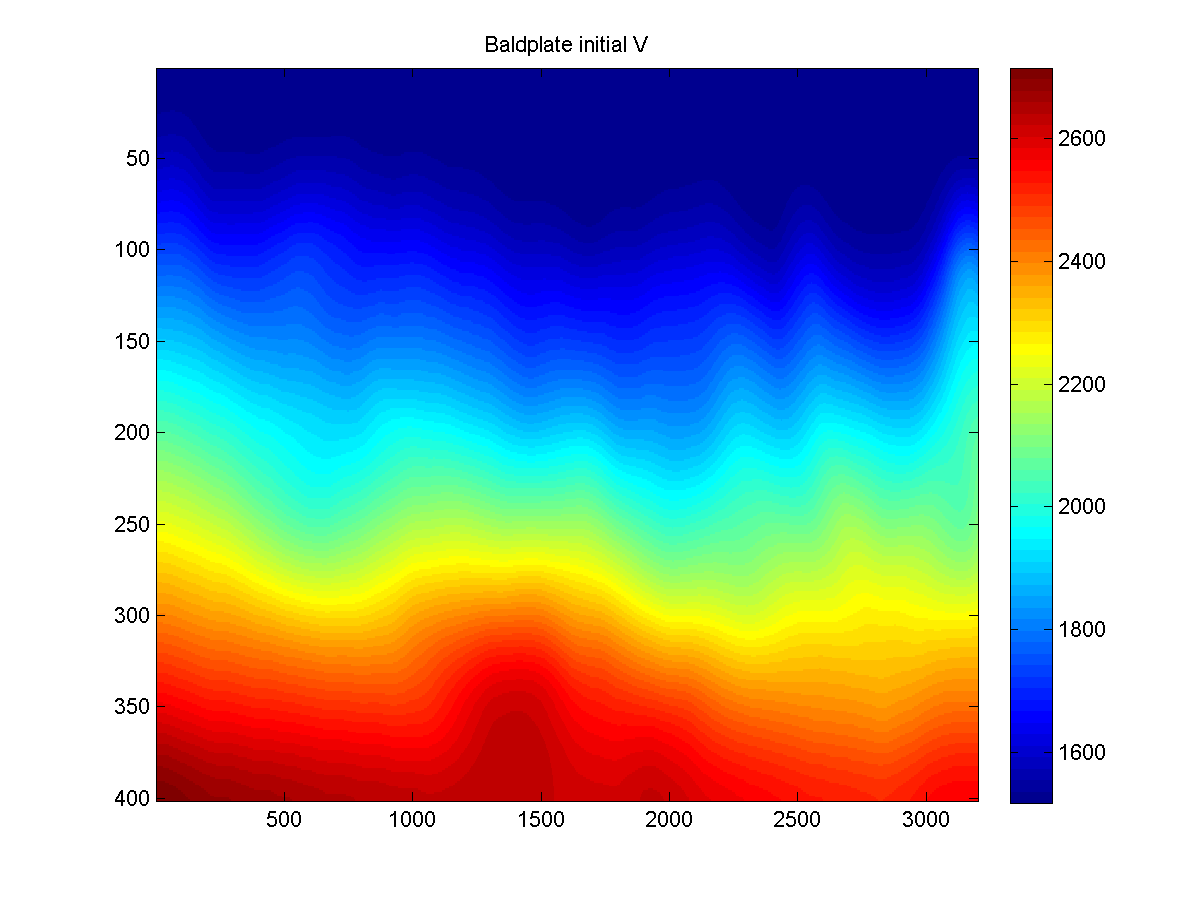
Figure 1. Baldplate Velocity Model after reverse engineering
Objective:
To generate a velocity model from a picture in a pdf file.
Procedure: Download the following files
Baldplate_initial_V.png,
clrbar.png,
vel.png,
image_deFrame.m,
image_deWhiteMargin.m,
invMap_colorbar.m,
outlier_removal.m,
velocity_reverseEngineering.m,
-
From a pdf file (or of other formats) of interest, crop out the photo of the (a) velocity model
and (b) the colorbar
- You can be lenient while cropping in 1(a), i.e., you can include some white margin
around the color-photo (see vel.png )
-
In 1(b), do not keep the white margin and black frame on the left and right sides.
Do include the white margin and black frame on the top and bottom sides (see clrbar.png )
- Note down the velocity range covered by the colorbar.
Explanation:
-
The pre-processing routines will remove the white margin and black coordinate frame.
Since color bar is constant horizontally, eventually only a 1d column vector (of the color mapping)
is to be kept. So, no need to include the boundaries on the left and right side to start with.
(In terms of image-cropping, this is easier than having to position the cursor carefully in order
to include the boundary.)
- Run the script at the bottom of (i.e., after the final "return")
velocity_reverseEngineering.m. The result is shown in Figure 1.
- The example provided here is for Baldplate data. Customize it for any velocity model of
your choice.