Next: Born Forward and Adjoint Up: Introduction Previous: Resolution Limits for Traveltime Contents
![\includegraphics[width=6in]{figs/CH2_fig20}](img364.png) |
![\includegraphics[width=6in]{figs/wavepath1/figfrezanew}](img368.png) |
The resolution limits for migration (Berkhout, 1984; Safar, 1985; Vermeer, 1997; Chen and Schuster, 1999) were later found to be equivalent to those
for linearized inversion in a homogeneous (Devaney, 1984; Wu and Toksoz, 1987)
and an inhomogeneous medium (Beylkin, 1985) with smooth velocity variations.
The key idea is that the
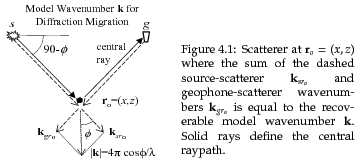
model wavenumber vector ![]() can
be equated to the sum of the source-scatterer
and geophone-scatterer wavenumbers
can
be equated to the sum of the source-scatterer
and geophone-scatterer wavenumbers
![]() shown in Figure 4.5.
If
shown in Figure 4.5.
If
![]() defines the range of wavenumbers
available from the source-receiver positions, then
the horizontal
defines the range of wavenumbers
available from the source-receiver positions, then
the horizontal ![]() and vertical
and vertical ![]() spatial resolution limits of the migration image are defined as
spatial resolution limits of the migration image are defined as

The above resolution analysis have been developed for migration and traveltime tomography, and until now, there has not been a comprehensive treatment of the resolution limits associated with FWI. I now present such an analysis by applying an asymptotic analysis to the model resolution function for FWI. The resulting resolution formulas can be used to better understand and optimize the resolution characteristics of FWI, LSM, and RTM.
This chapter is organized into three sections. The introduction heuristically explains how wavepaths are used to estimate resolution for both traveltime tomography and migration. This leads to an intuitive description of spatial resolution as the minimum width and height of the intersection of Fresnel zones at the trial image point. The next section validates this heuristic definition by rigorously deriving the resolution limits for each type of wavepath, and explains their relationship to the acquisition geometry. Finally, a discussion and summary is given.
Yunsong Huang 2013-09-22